Abhishek Sampath Kumar, Luyi Tian, Adriano Bolondi, Amèlia Aragonés Hernández, Robert Stickels, Helene Kretzmer, Evan Murray, Lars Wittler, Maria Walther, Gabriel Barakat, Leah Haut, Yechiel Elkabetz, Evan Z. Macosko, Léo Guignard, Fei Chen & Alexander Meissner
18k Accesses, 4 Citations, 99 Altmetric
Abstract
Spatiotemporal orchestration of gene expression is required for proper embryonic development. The use of single-cell technologies has begun to provide improved resolution of early regulatory dynamics, including detailed molecular definitions of most cell states during mouse embryogenesis. Here we used Slide-seq to build spatial transcriptomic maps of complete embryonic day (E) 8.5 and E9.0, and partial E9.5 embryos. To support their utility, we developed sc3D, a tool for reconstructing and exploring three-dimensional ‘virtual embryos’, which enables the quantitative investigation of regionalized gene expression patterns. Our measurements along the main embryonic axes of the developing neural tube revealed several previously unannotated genes with distinct spatial patterns. We also characterized the conflicting transcriptional identity of ‘ectopic’ neural tubes that emerge in Tbx6 mutant embryos. Taken together, we present an experimental and computational framework for the spatiotemporal investigation of whole embryonic structures and mutant phenotypes.
Main
Embryonic development necessitates the precise timing and location of numerous molecular, cellular and tissue-level processes1,2,3,4,5. These events are directed via spatiotemporal control of gene expression that orchestrates cell type specification, migration and localization6,7,8,9. Any disruption of this regulation often results in embryonic lethality or developmental defects5,10,11. At the end of gastrulation and the onset of organogenesis (embryonic days (E) 8.5–9.5), tissues experience major morphological changes, such as heart looping, brain compartmentalization and neural tube folding, to guarantee proper structure and function12,13,14. Through neurulation, epithelial cells in the neural plate fold to form a morphologically defined tube, which exhibits a stratified gene expression signature along its dorsoventral (DV) axis, which is necessary for subsequent neuronal subtype diversification15,16,17,18,19,20,21. Many genes involved in this process have been identified, but the precise gene regulatory networks governing these patterns remain under investigation. Recent single-cell studies have begun to provide a deeper understanding of the topography of fate specification and highlighted some molecular mechanisms underlying these cell state transitions22,23,24,25,26,27,28. One limitation of dissociation-based approaches is their inability to preserve tissue structure, which precludes expression analysis within the native context. Recent advances in spatial transcriptomic technologies have begun to fill this gap, aiming to explore the organization of cell types within adult tissues and developing embryos29,30,31,32,33,34,35,36,37,38.
In this study, we used Slide-seq, a technology that generates transcriptome-wide gene expression data at 10-µm spatial resolution33,39, to build maps of whole embryos during early mouse organogenesis. Our data enabled the exploration of spatial gene expression patterns, cell state distributions, the reconstruction of three-dimensional (3D) transcriptomic maps for ‘virtual’ gene expression analysis and mutant phenotype dissection. We specifically leveraged the data to identify regionalized gene expression and differentiation trajectories in space, focusing on neural tube formation and patterning. Overall, we provide a comprehensive, high-resolution spatial atlas together with an accessible and ready-to-use visualizer to explore gene expression patterns in the developing mouse embryo.
Results
Spatial transcriptomic maps to construct 3D virtual embryos
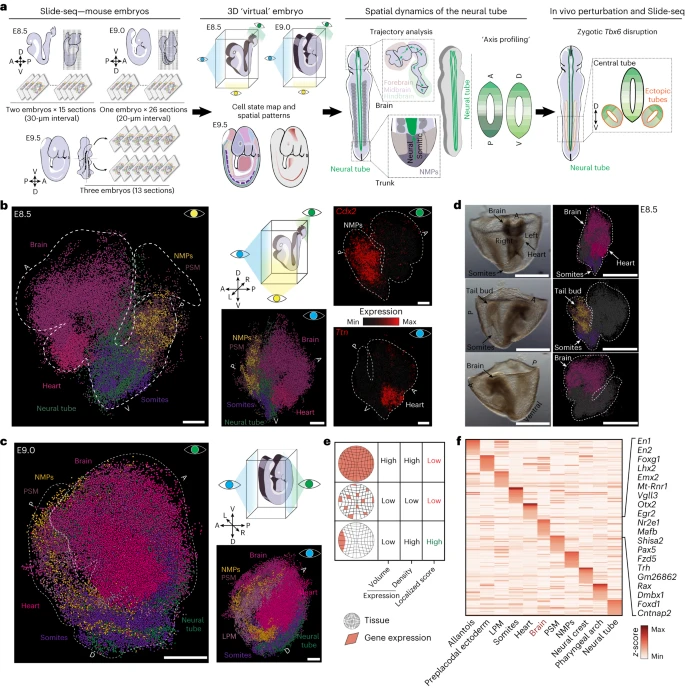
To spatially map cell identities during early organogenesis, we used Slide-seq on two representative E8.5, one E9.0 and three partial E9.5 embryos (Fig. 1a and Extended Data Fig. 1a). For the two E8.5 embryos, we obtained 15 and 17 sagittal sections (10-µm thickness), respectively, with approximately 30-µm intervals between them. For the E9.0 embryo, 26 sagittal sections with 20-µm intervals, and for the three E9.5 embryos, 13 slices from the midline were obtained (Fig. 1a and Supplementary Table 1). In total, we recovered 533,116 high-quality beads with a median value of 1,798 transcripts and 1,224 genes per bead (Extended Data Fig. 1b–d). To ascertain the cell states assigned to each bead, we computationally mapped beads to a previously generated single-cell reference (Extended Data Fig. 1e,f)26. With this information, we extracted from each sequenced bead (1) spatial coordinates, (2) associated gene expression profile and (3) cell state assignment. Overall, we observed good alignment of cell states and spatial restriction of marker genes, such as Ttn (heart), T (tail bud), Meox1 (somites) and Sox2 (neural tube, brain), among others (Extended Data Fig. 2a–e). Additionally, we observed high reproducibility in recovering a comparable embryo composition and gene expression patterns among replicates (Extended Data Fig. 2c–f).